Dashboard BuilderTM for Microsoft® AccessTM
Dashboard Filter Prompts
Dashboard Builder's filter prompt feature lets you prompt a user to
choose a value that graphs or metrics should be filtered by.
For example, you may wish to have a dashboard that displays
important metrics for sales, and be able to filter the values by
Region. Instead of creating separate metrics and dashboards
for each sales region, you create each of your metrics to
dynamically filter the values "on-the-fly." Both
data and graph dashboards support filter promts.
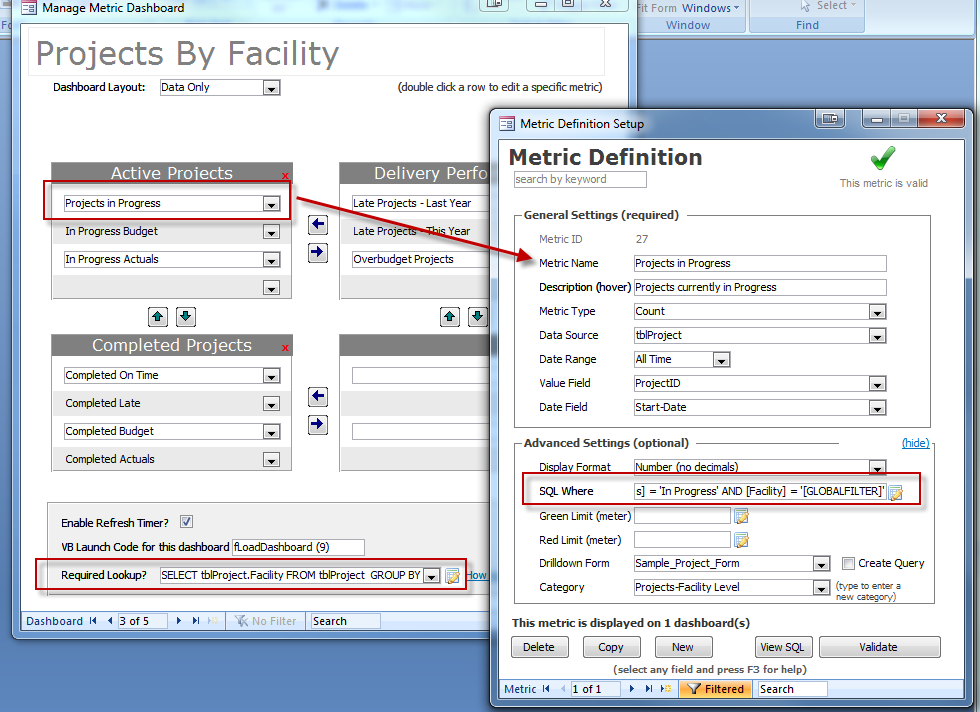
- In the Dashboard you want to be able to filter, click the "Advanced" link near the bottom-right of the administration screen.
- Select the edit icon next to the "Required Lookup?" field.

- In the Lookup Builder, choose the table that will contain the values you want to prompt the user with. For example, the list of sales regions table. You'll use the Lookup Builder in the same way you would to create a query. Note that if you want to use a primary key value (e.g., RegionID) but display a text value (e.g., Sales Region) include both in the query. Dashboard Builder will know to display the second field to the user, but use the first value as the actual filter value.
- Click the "Save and Continue" button to save your lookup query.
- Create your new metrics or graphs you want to add to the dashboard. In the "SQL Where" field, make sure to add the following: [YOURFIELDNAME] = [GLOBALFILTER]. In the previous example, the [GLOBALFILTER] tag will be replaced with whatever value the user selects when launching your dashboard. Note that you should surround [GLOBALFILTER] with quotes if your filter value will be a text value.
- Add your graphs or metrics to your dashboard. When you launch your dashboard, it will prompt you to choose from the list of available values you defined in step 3.