Microsoft Excel provides a flexible grid interface to organize, calculate, and analyze nearly any type of information.
The true power of Excel lies in its versatility. Users can define custom layouts, input formulas, and structure data without specialized database administration skills. Decades after its introduction, Excel remains the world's leading spreadsheet software for business, finance, and scientific modeling.
Not a Microsoft user? Just replace "Microsoft Excel" here with "Google Sheets" and everything is essentially still the same.
Major Uses for Microsoft Excel
Excel serves as a cornerstone tool across multiple business, technical, and analytical disciplines:
Financial Planning & Modeling
Create balance sheets, cash-flow projections, quarterly budgets, amortization schedules, and corporate annual financial reports.
Data Tracking & Operations
Manage pipeline sales leads, inventory counts, employee scheduling, customer contact logs, and invoicing.
Scientific & Statistical Analysis
Execute regression analysis, chi-square testing, variance calculations, and statistical hypothesis testing on large datasets.
Executive Dashboards
Synthesize disparate data sources into clear KPI scorecards using conditional formatting and pivot visualizations.
How Excel Works: Workbooks, Sheets & Cells
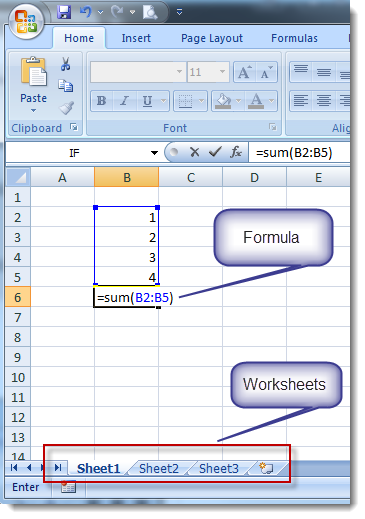
An Excel file is known as a Workbook. Every workbook contains one or more Worksheets (spreadsheets) arranged in a grid of rows and columns.
- Rows & Columns: Columns are denoted alphabetically (A, B, C...), while rows are numeric (1, 2, 3...).
- Cells: The intersection of any row and column forms a
distinct Cell (e.g.,
B4) capable of holding text, numbers, dates, or formulas. - Formatting: Cells can be styled with custom font families, borders, decimal precisions, and background fill colors.
Excel Formulas & Functions
Formulas allow automated mathematical and logical calculations across individual cells or
dynamic ranges. Inputs can include constants (e.g., =5*2+3), cell references (e.g.,
=SUM(A1:A10)), or nested logical operations.
Excel includes an extensive built-in library of statistical, financial, and mathematical
functions, including
Net Present Value (NPV),
Standard Deviation,
XLOOKUP/VLOOKUP, loan amortization calculations, and trigonometric
equations.
Data Visualization: Standard Charts & Pivot Tables
Excel provides two primary visual tools for interpreting data: Standard Charts and Pivot Tables / Pivot Charts.
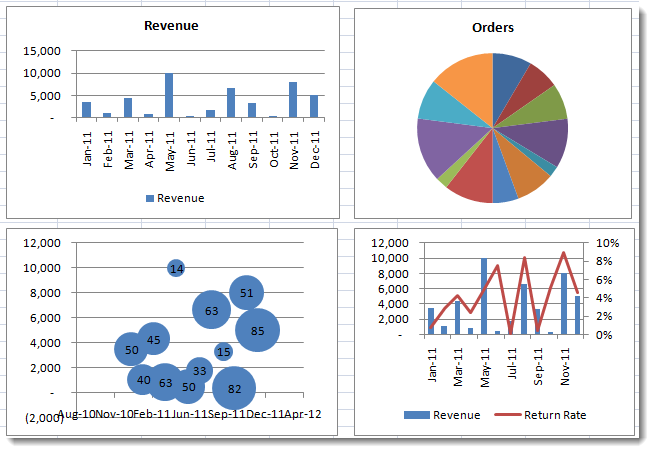
Standard charts (bar, line, scatter, pie) update dynamically whenever referenced cells are modified.
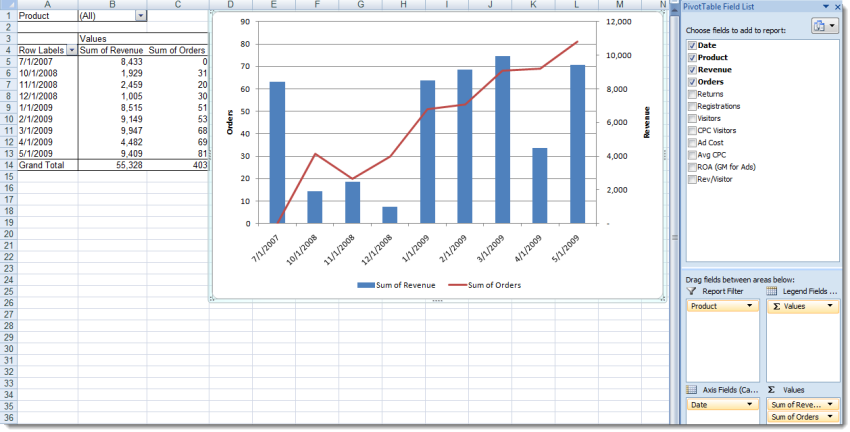
Pivot tables aggregate large transaction logs, allowing multi-dimensional grouping and slicing without altering raw underlying records.
Excel vs. Word Tables: When to Use Each
Selecting between Microsoft Word tables and Microsoft Excel depends on the proportion of prose versus dynamic computation:
| Requirement / Use Case | Recommended Tool |
|---|---|
| Primarily descriptive text or structured documentation | Microsoft Word or Google Docs |
| Mixed prose and static numeric information | Word Table or Excel |
| Dynamic numeric calculations and continuous formula updates | Microsoft Excel or Google Sheets |
| Conditional formatting based on relative dates or KPIs | Microsoft Excel or Google Sheets |
| Multi-column sorting, filtering, and data aggregation | Microsoft Excel or Google Sheets |
| Strong data validation, consistency for large data sets | Microsoft Access |
| Data entry and navigation between "parent" information and "child" information (e.g., customers and orders) | Microsoft Access |
| Complex queries, reports, and data searches | Microsoft Access |
When Does Excel Reach Its Limits? Excel vs. Microsoft Access
While Excel is unmatched for individual analytical tasks, multi-user concurrency and relational data often require a relational database like Microsoft Access.